
When your project is live, you can view statistics that give insight into the health and efficiency of your project.
To view these statistics, click on your project from the Dashboard. The next page will display how many participants have completed your project, how many have been Approved or Rejected by you and metrics like the percentage of participants who have bounced from your project and the average completion time.
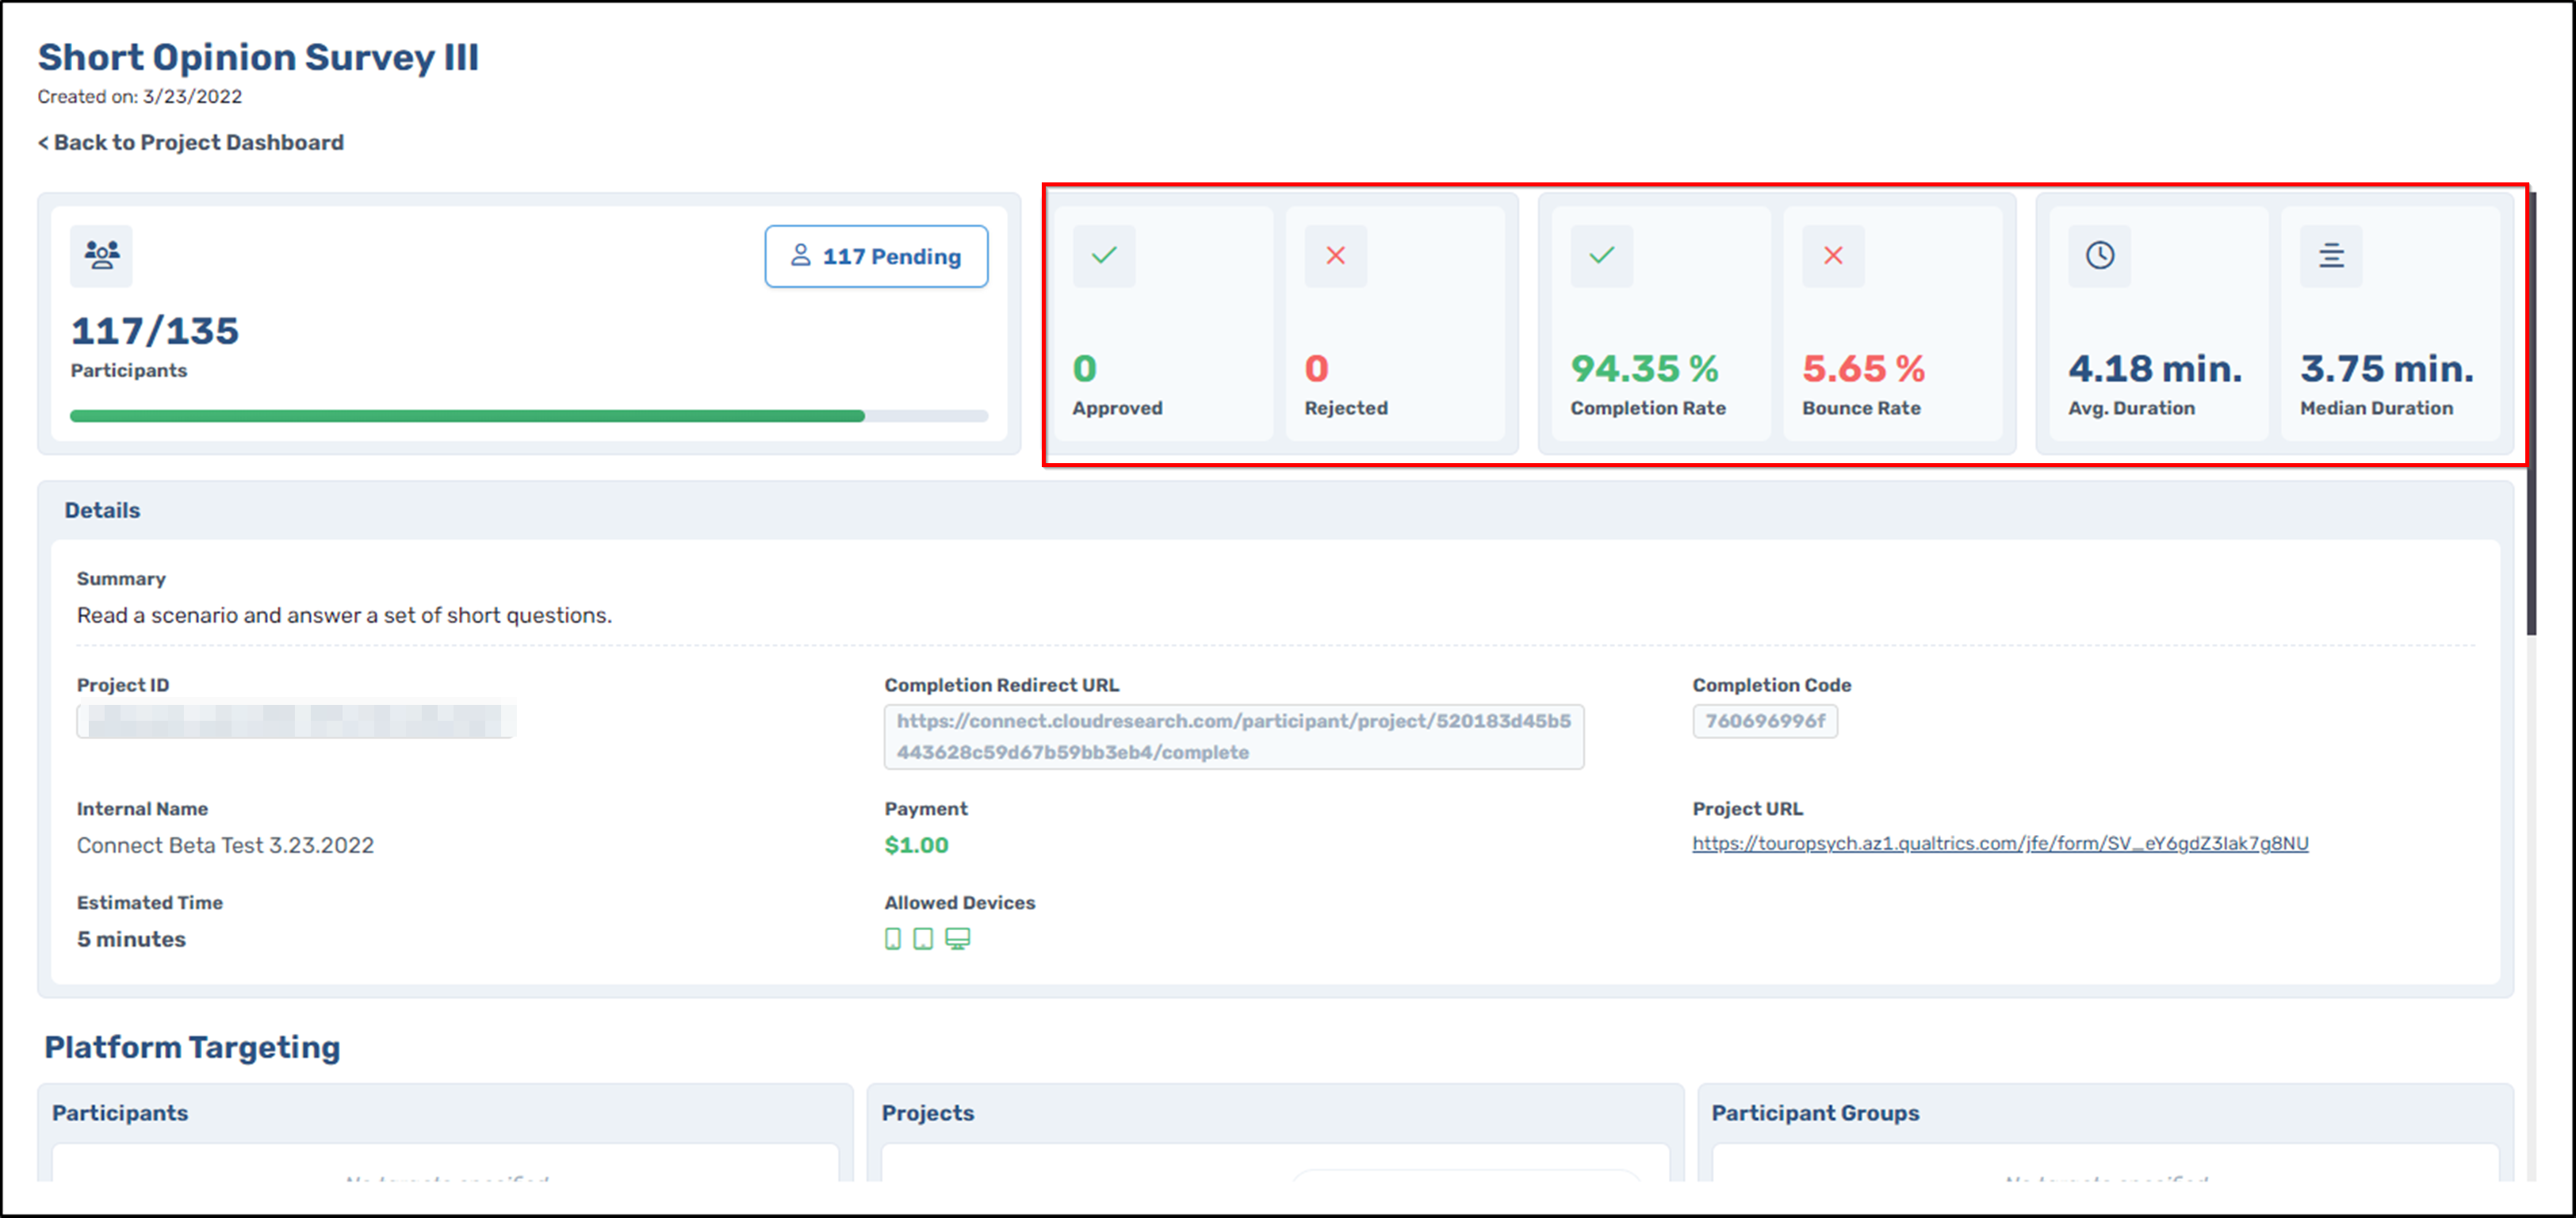
Monitoring these statistics can sometimes provide insight into why a project may be moving slow or struggling to recruit the desired sample. For example, a project with a high bounce rate may signal that something about the task is causing several participants to return the task rather than complete the project. Projects with an average completion time significantly higher than the original estimate may signal that the researchers underestimated how long the study takes and perhaps how much it should pay.
Comments
1 comment
Nice one 💯
Please sign in to leave a comment.